
授权转载声明
转载需先申请授权,并保留授权码、原文地址和文中 go/affiliate 链接。
原文地址:https://www.geekcorelab.com/post/record-a-visualization-of-resource-utilization-using
如果您使用1Panel,Grafana和Prometheus都是有1Panel的一键版本的,但使用1Panel应用的方法未经测试
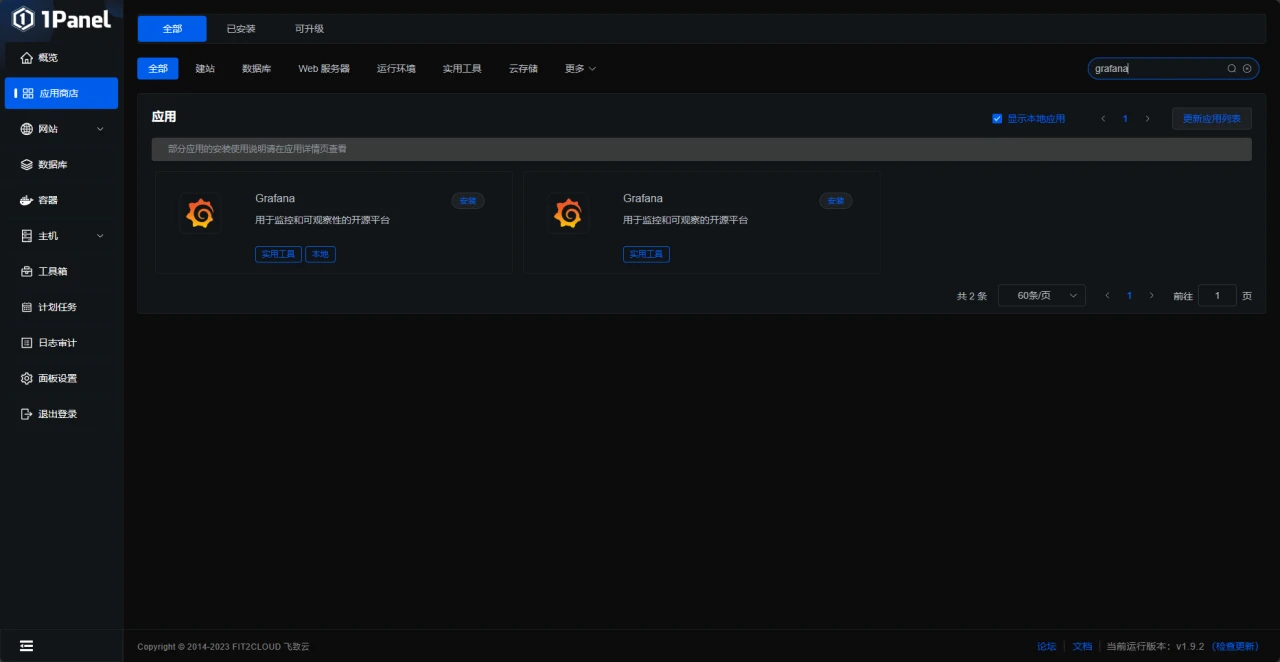
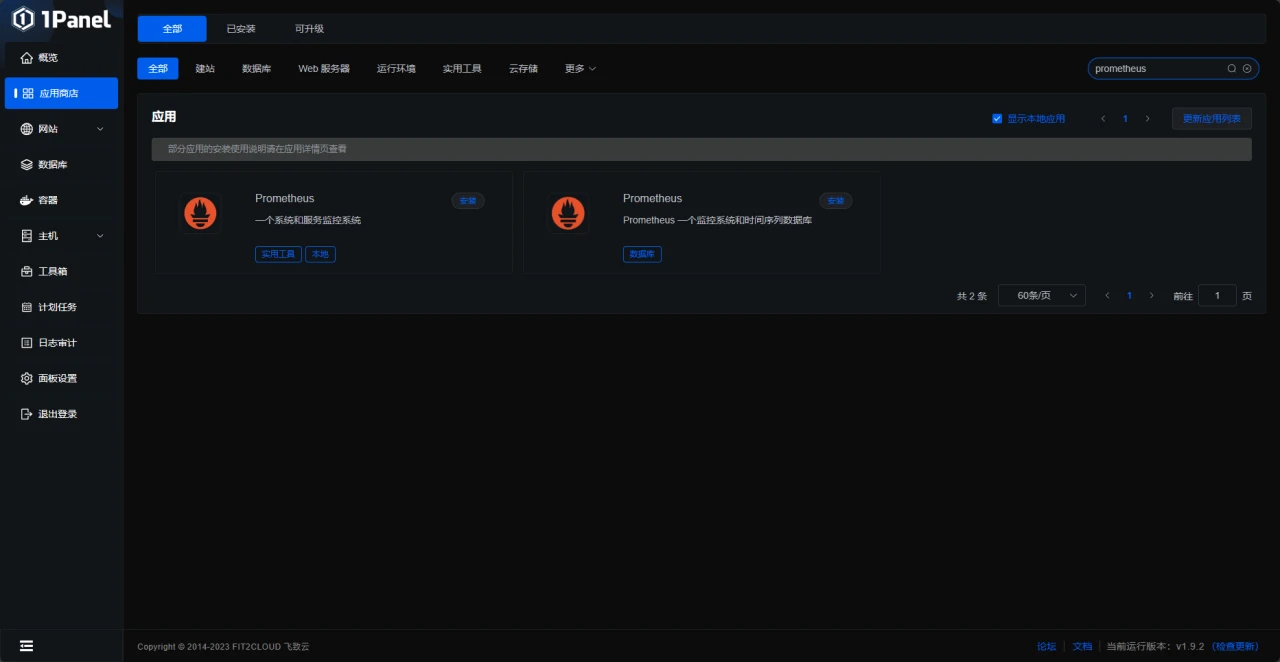
如果你希望使用1Panel,可以在购买服务器时选择预装
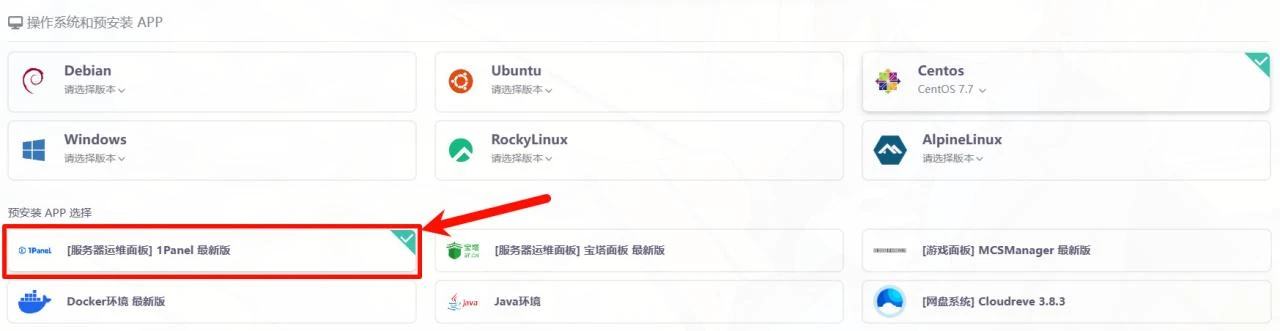
上图为雨云的预装示例,某些服务商可能不支持预装,请看 在线安装 - 1Panel 文档
本文以家里云+centos做演示
准备工作
首先准备好软件环境
-
- node_exporter
-
- prometheus
-
- grafana
这些是必备的
安装工作
首先我们安装node_exporter
node_exporter的作用是用于机器系统数据收集。
官网下载包
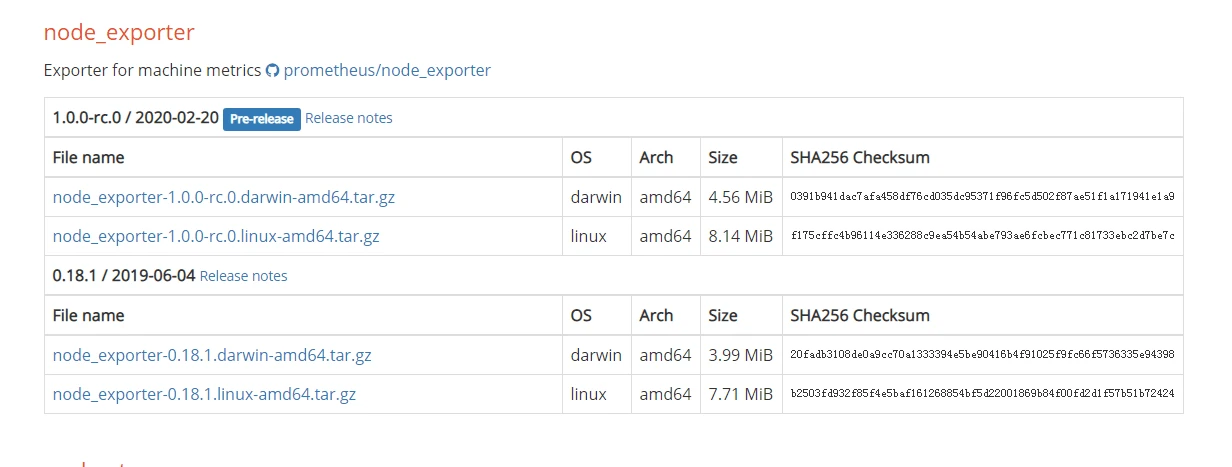
利用Linux命令下载安装
wget https://github.com/prometheus/node_exporter/releases/download/v1.0.0-rc.0/node_exporter-1.0.0-rc.0.linux-amd64.tar.gz #下载node_exporter包
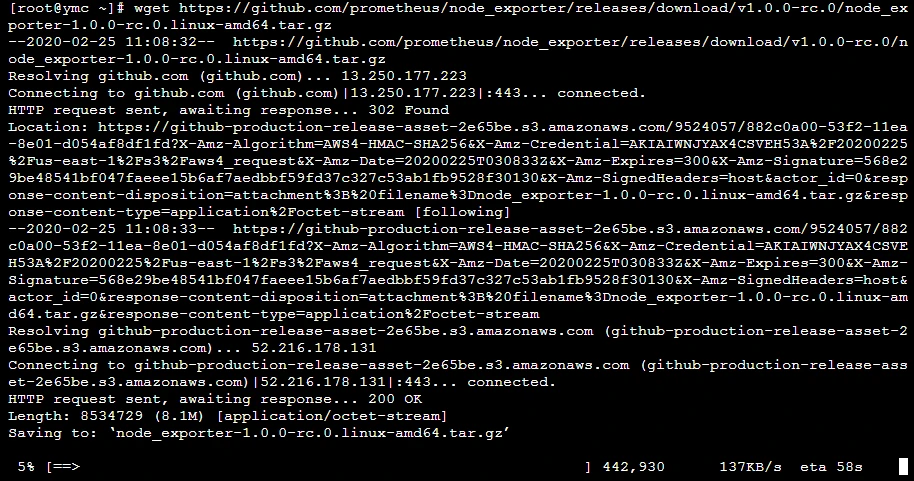
tar xvf node_exporter-1.0.0-rc.0.linux-amd64.tar.gz #解压下载来的包

mv node_exporter-1.0.0-rc.0.linux-amd64 node_exporter #把解压的目录改成node_exporter

cd node_exporter #进入node_exporter目录

./node_exporter #运行node_exporter
看到这图片代码安装运行成功了
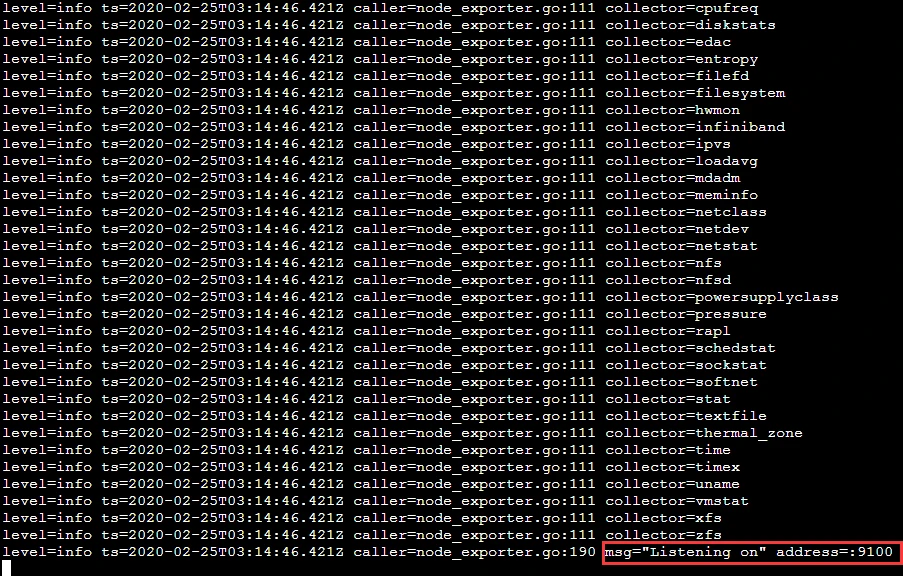
访问 http://localhost:9100/metrics
接下来安装prometheus
Prometheus的一类数据采集组件的总称。它负责从目标处搜集数据,并将其转化为Prometheus支持的格式。
官网下载包
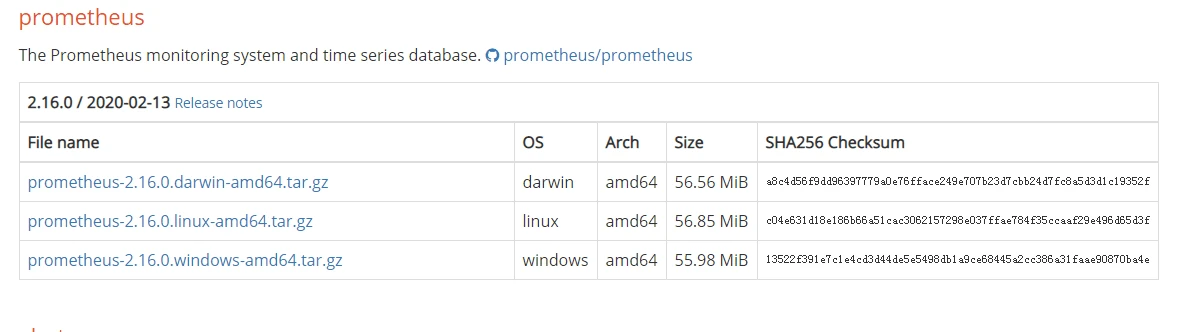
利用Linux命令下载安装
wget https://github.com/prometheus/prometheus/releases/download/v2.16.0/prometheus-2.16.0.linux-amd64.tar.gz
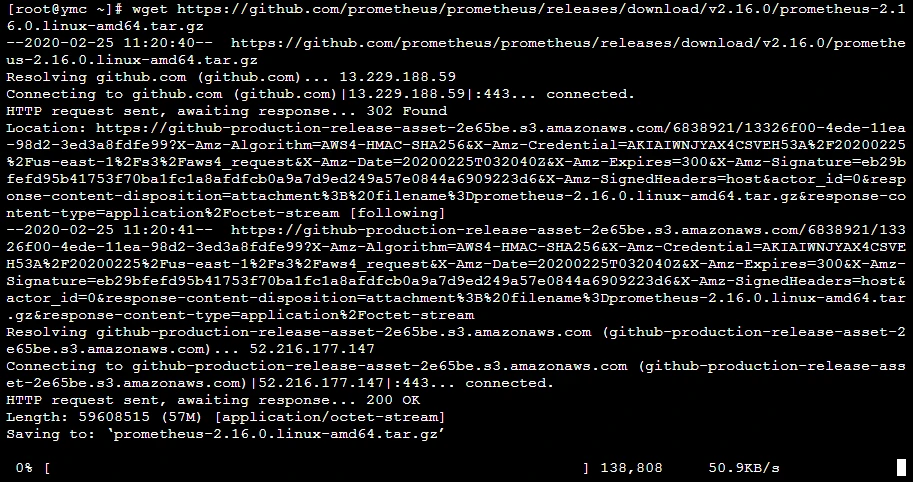
tar xvf prometheus-2.16.0.linux-amd64.tar.gz #解压下载来的包

mv prometheus-2.16.0.linux-amd64.tar.gz prometheus#把解压的目录改成prometheus

cd prometheus #进入prometheus目录
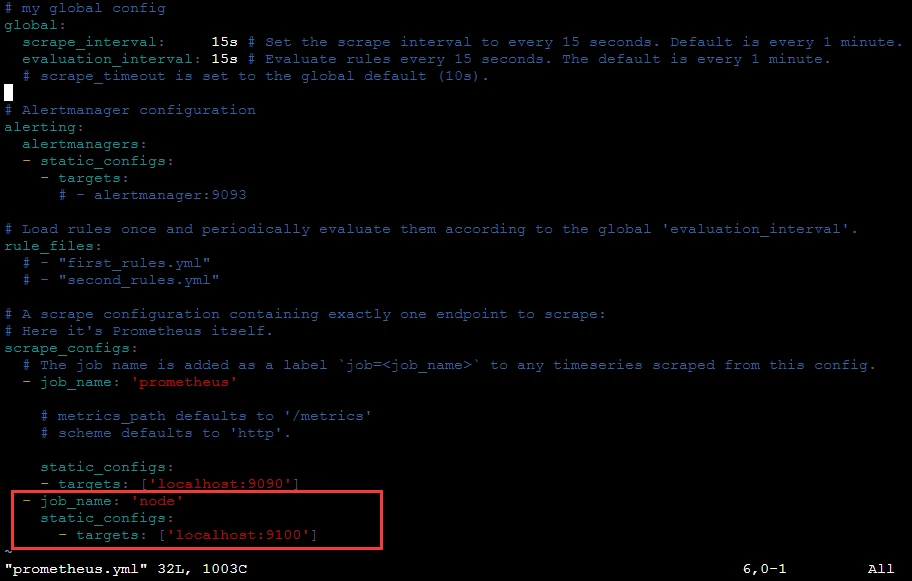
这里我们要注意修改prometheus的配置文件

利用vim在prometheus.yml文件scrape_configs下添加
 - job_name: 'node'
    static_configs:
      - targets: ['localhost:9100']
这里监听node_exporter的数据
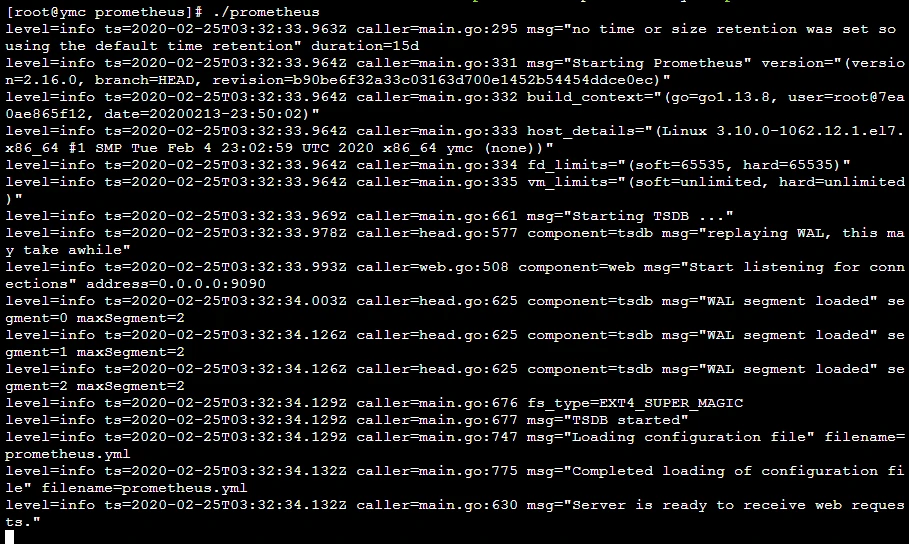
最后我们启动prometheus服务
./prometheus #启动prometheus服务
访问 http://47.103.87.205:9090/graph
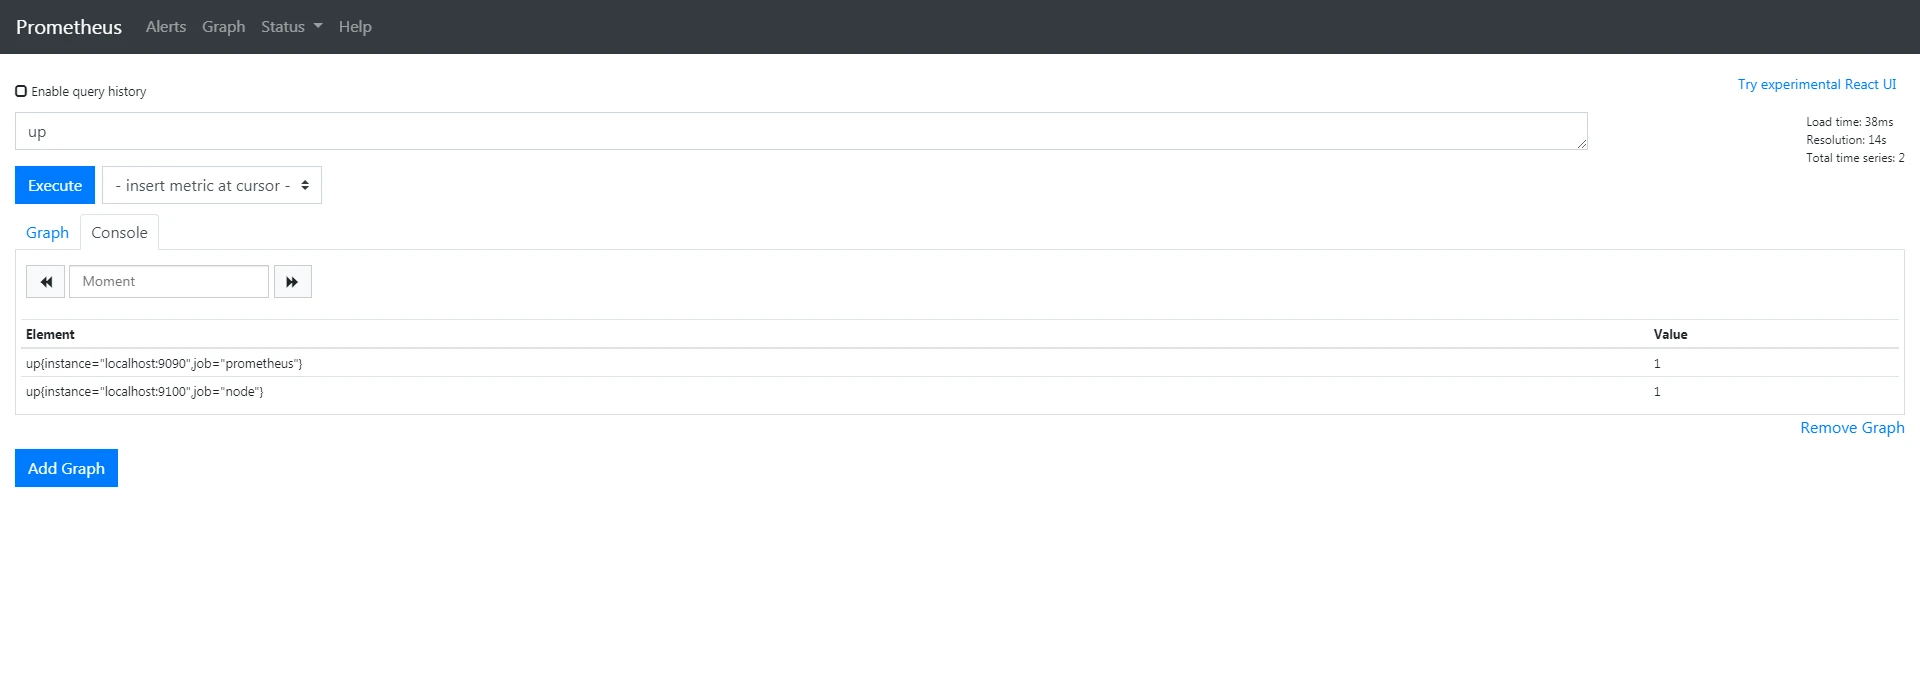
搜索up出现以下图片代表运行成功数据监听成功
如果
up{instance="localhost:9090",job="prometheus"}    0
up{instance="localhost:9100",job="node"}    0
代表数据没监听到
最后我们安装grafana
wget https://dl.grafana.com/oss/release/grafana-6.6.2-1.x86_64.rpm
sudo yum localinstall grafana-6.6.2-1.x86_64.rpm
其他服务器看官网
地址 https://grafana.com/grafana/download?platform=linux
sudo systemctl start grafana-server #启动grafana
访问 http://localhost:3000/login
默认账号密码是 admin

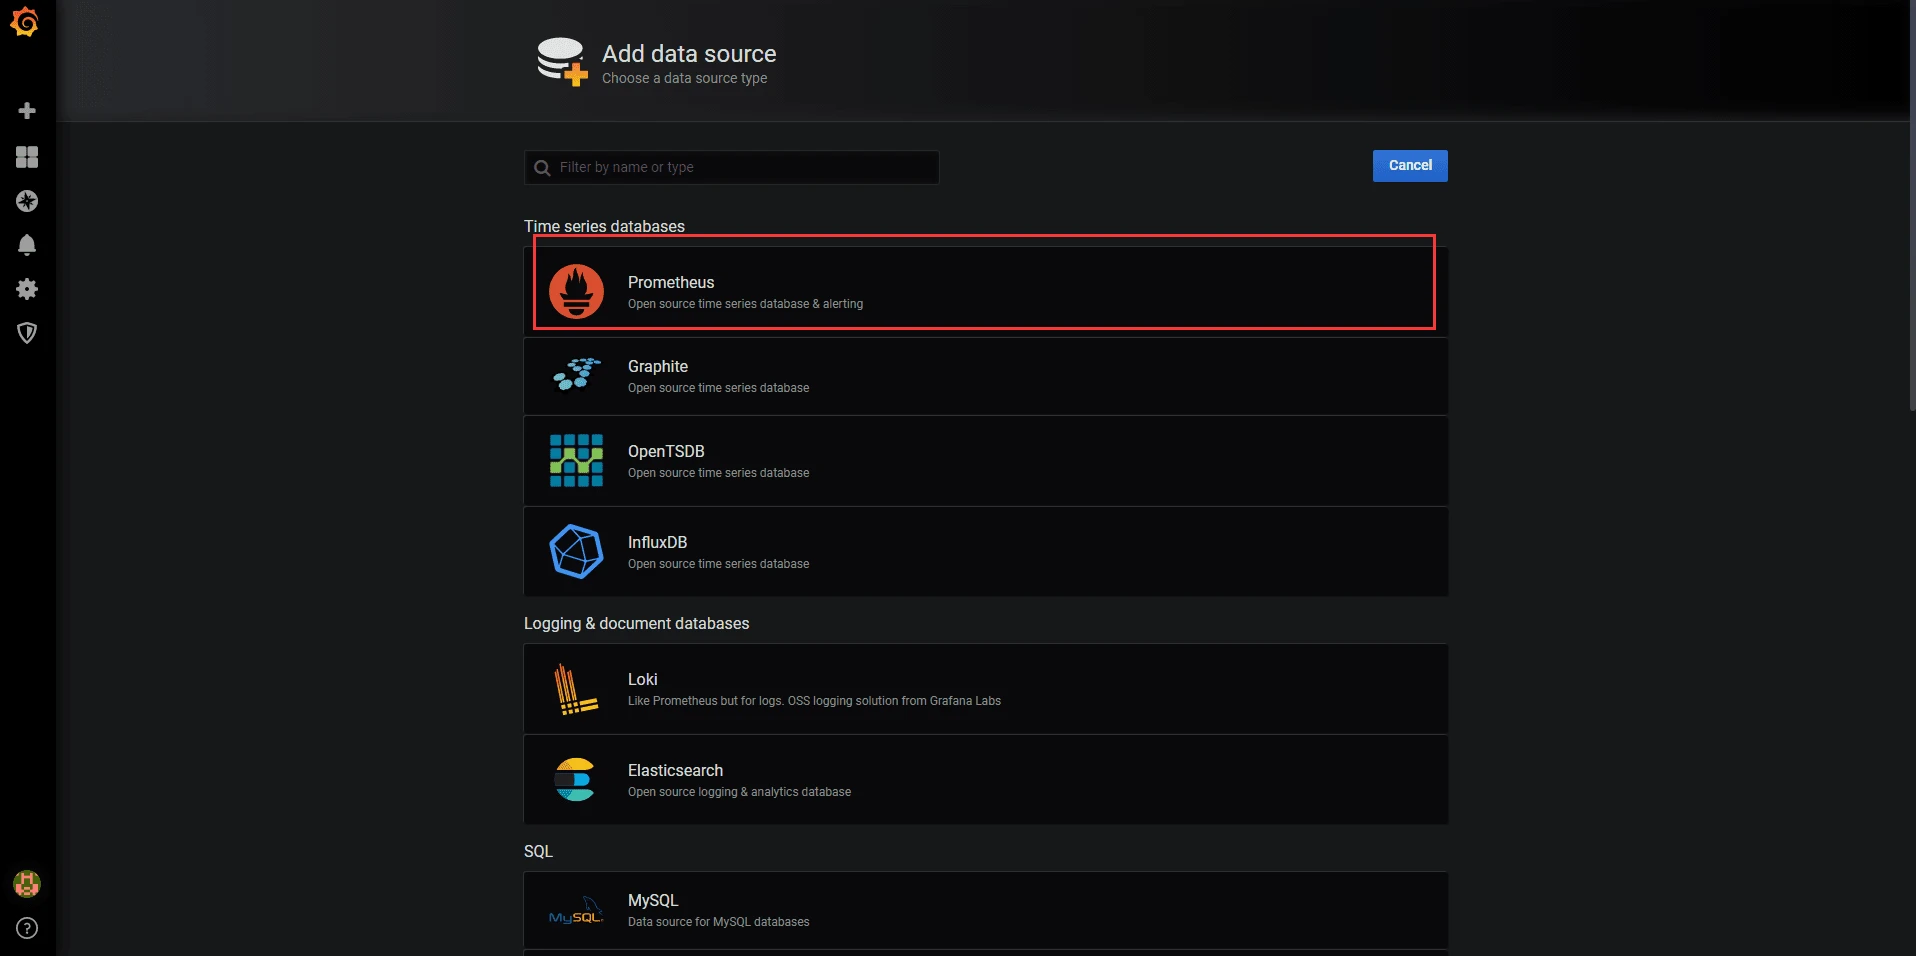
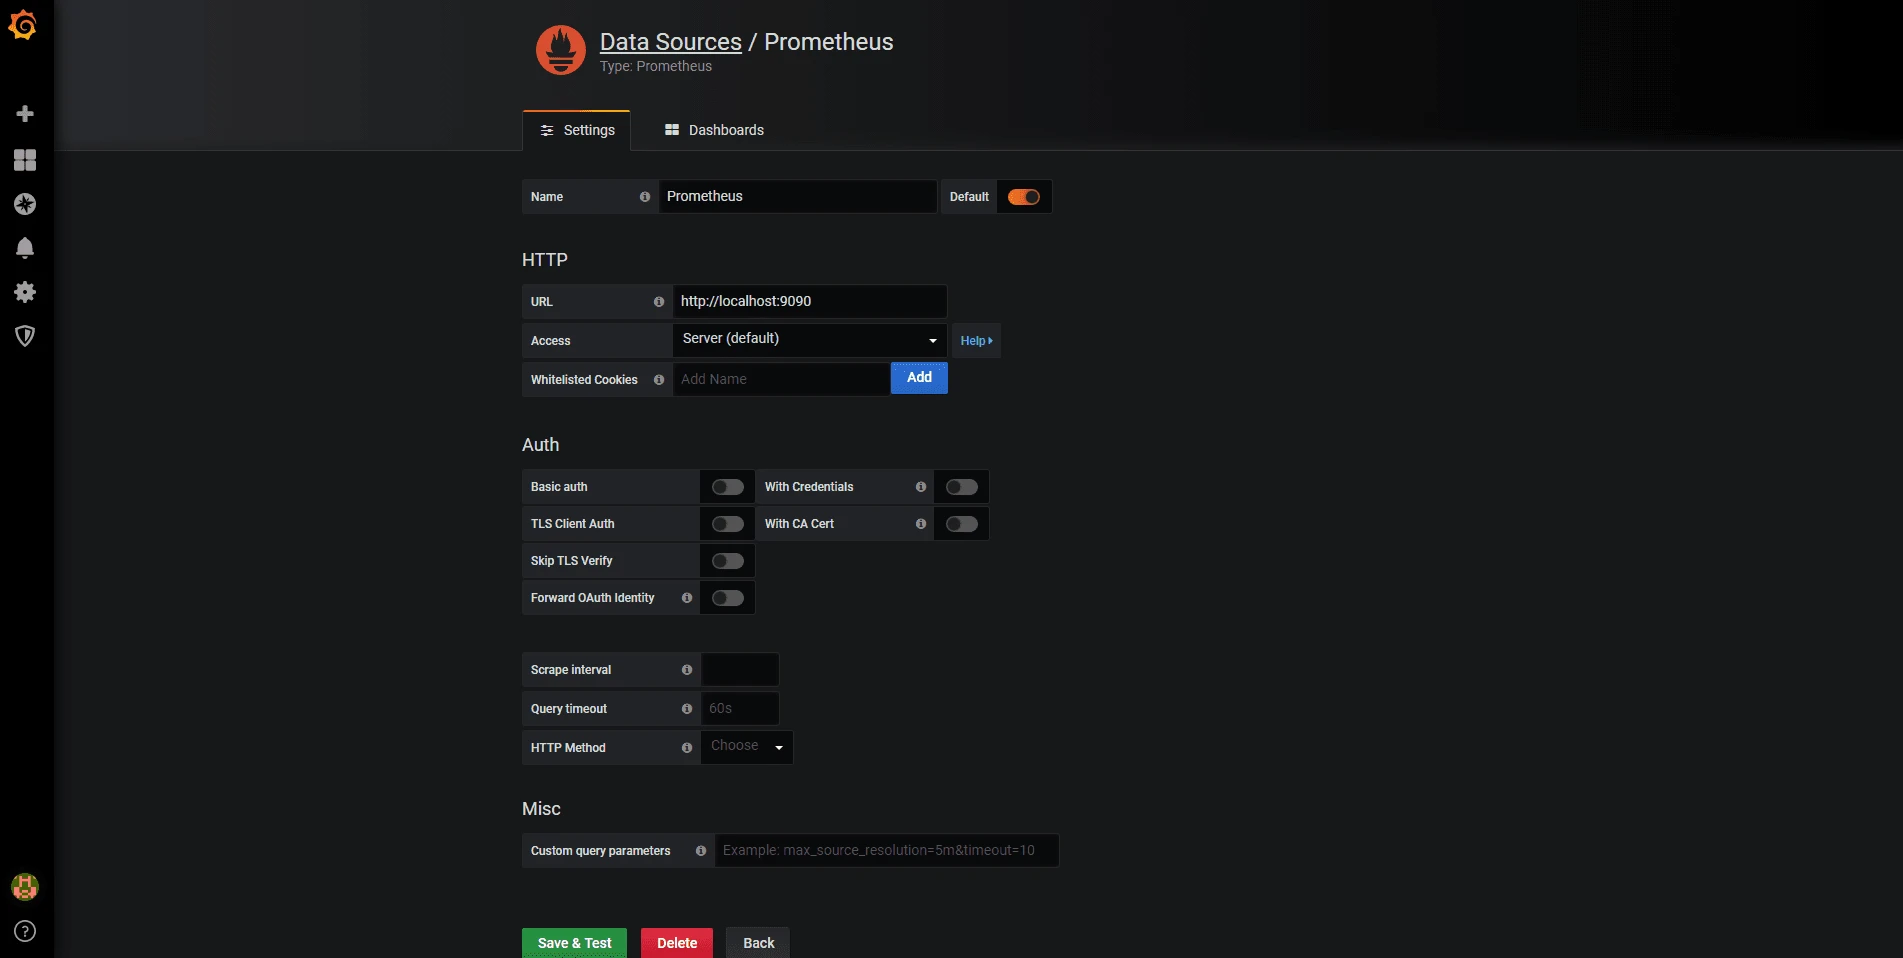
添加prometheus数据源
添加Dashboards
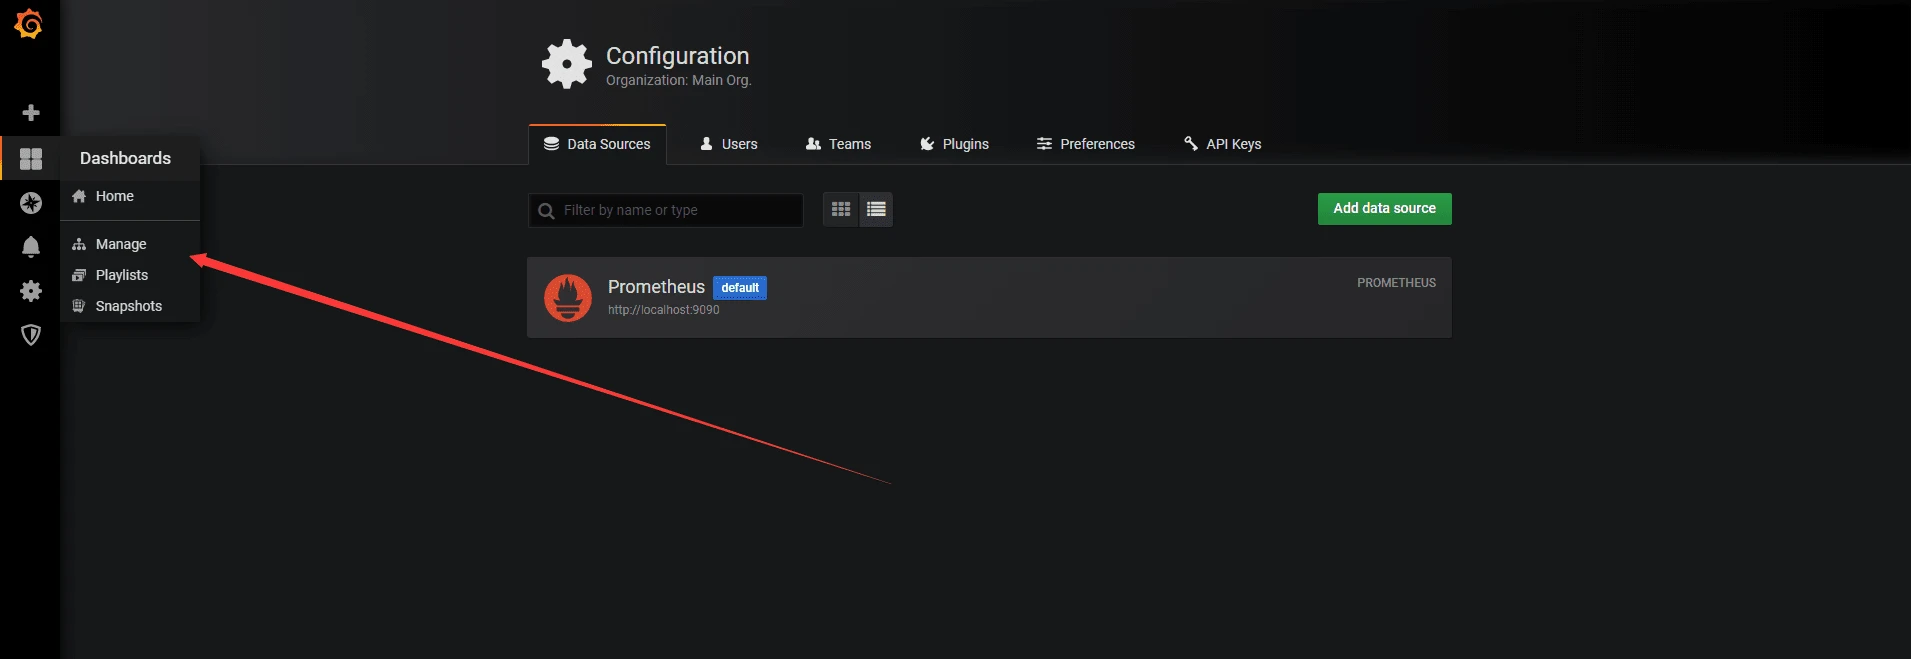
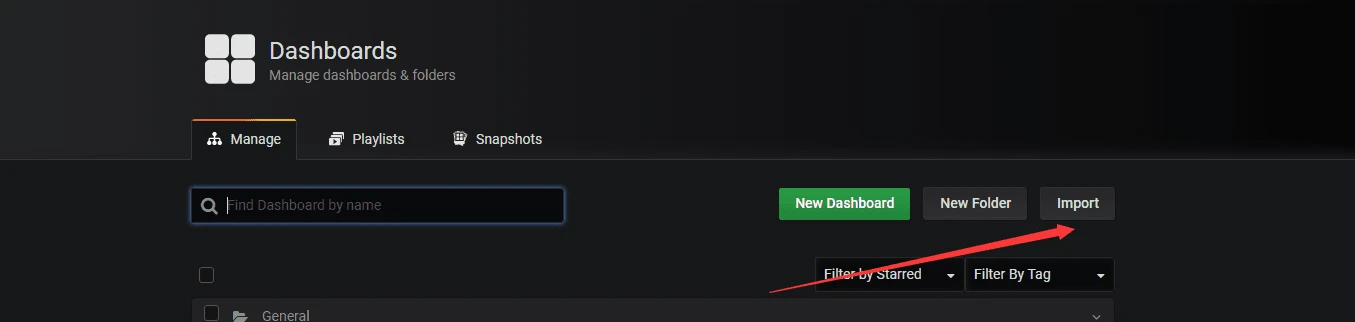
这里我们点Import 导入Dashboards
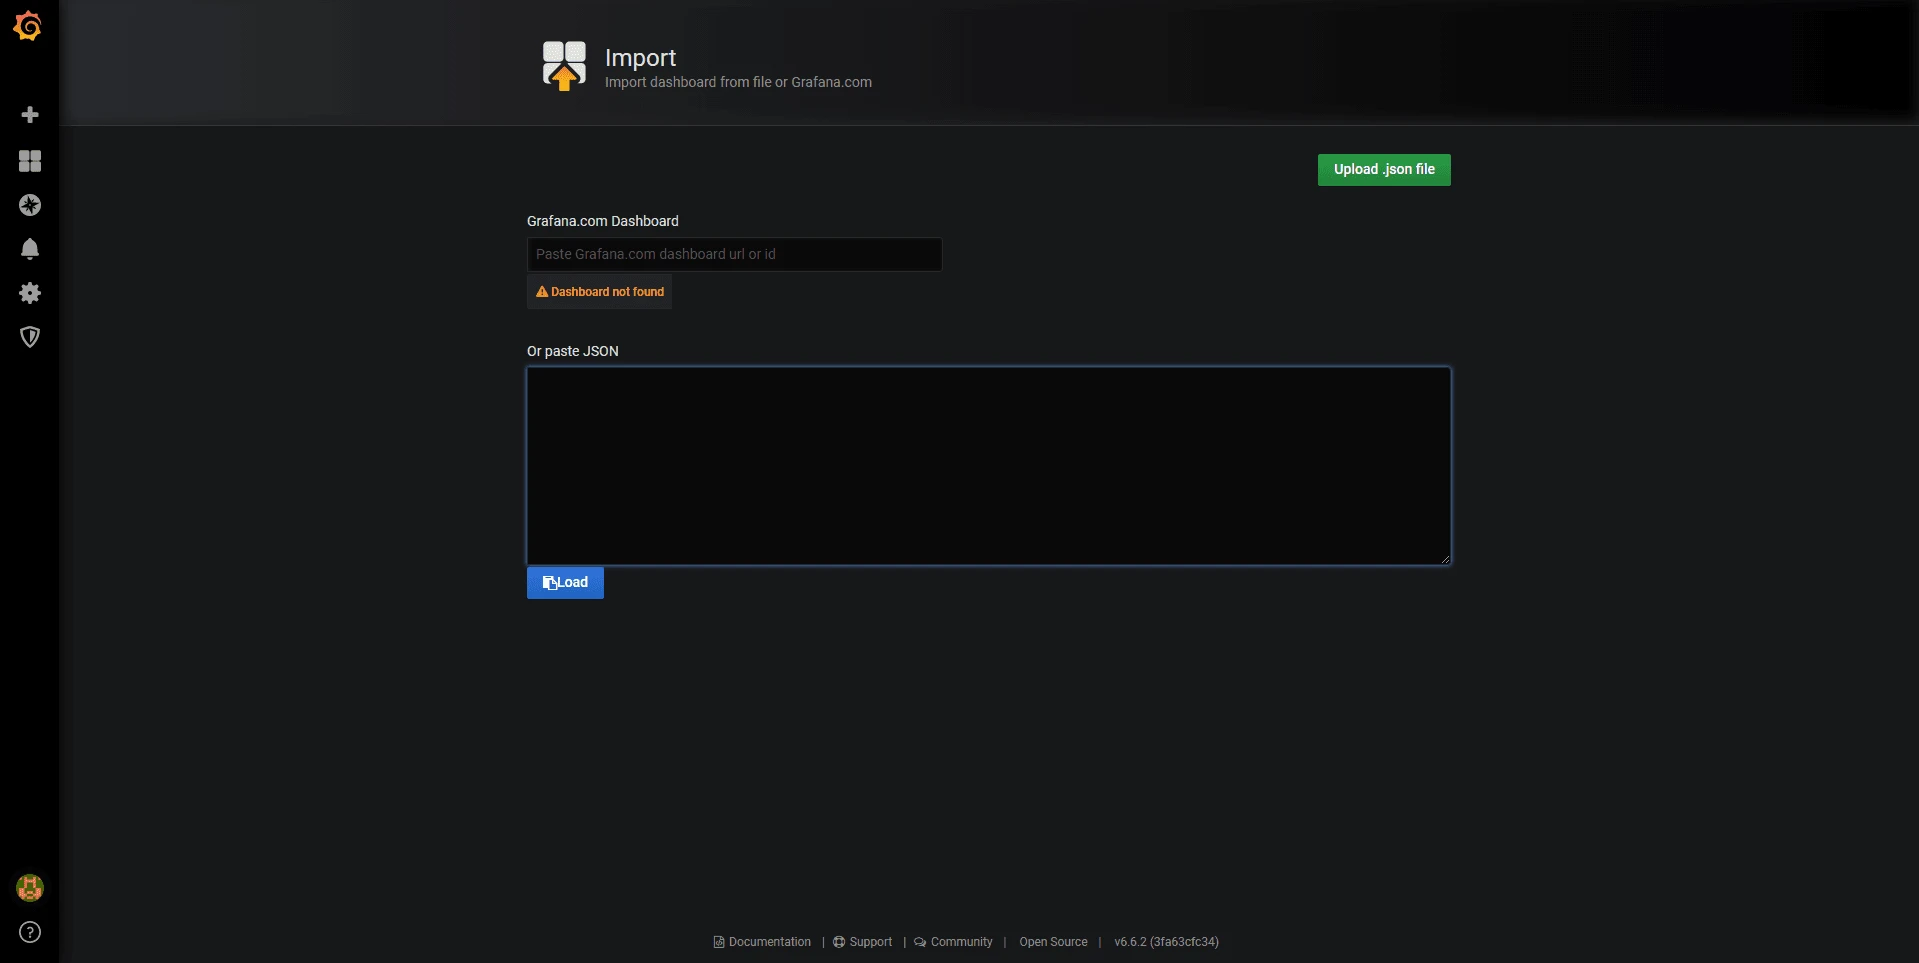
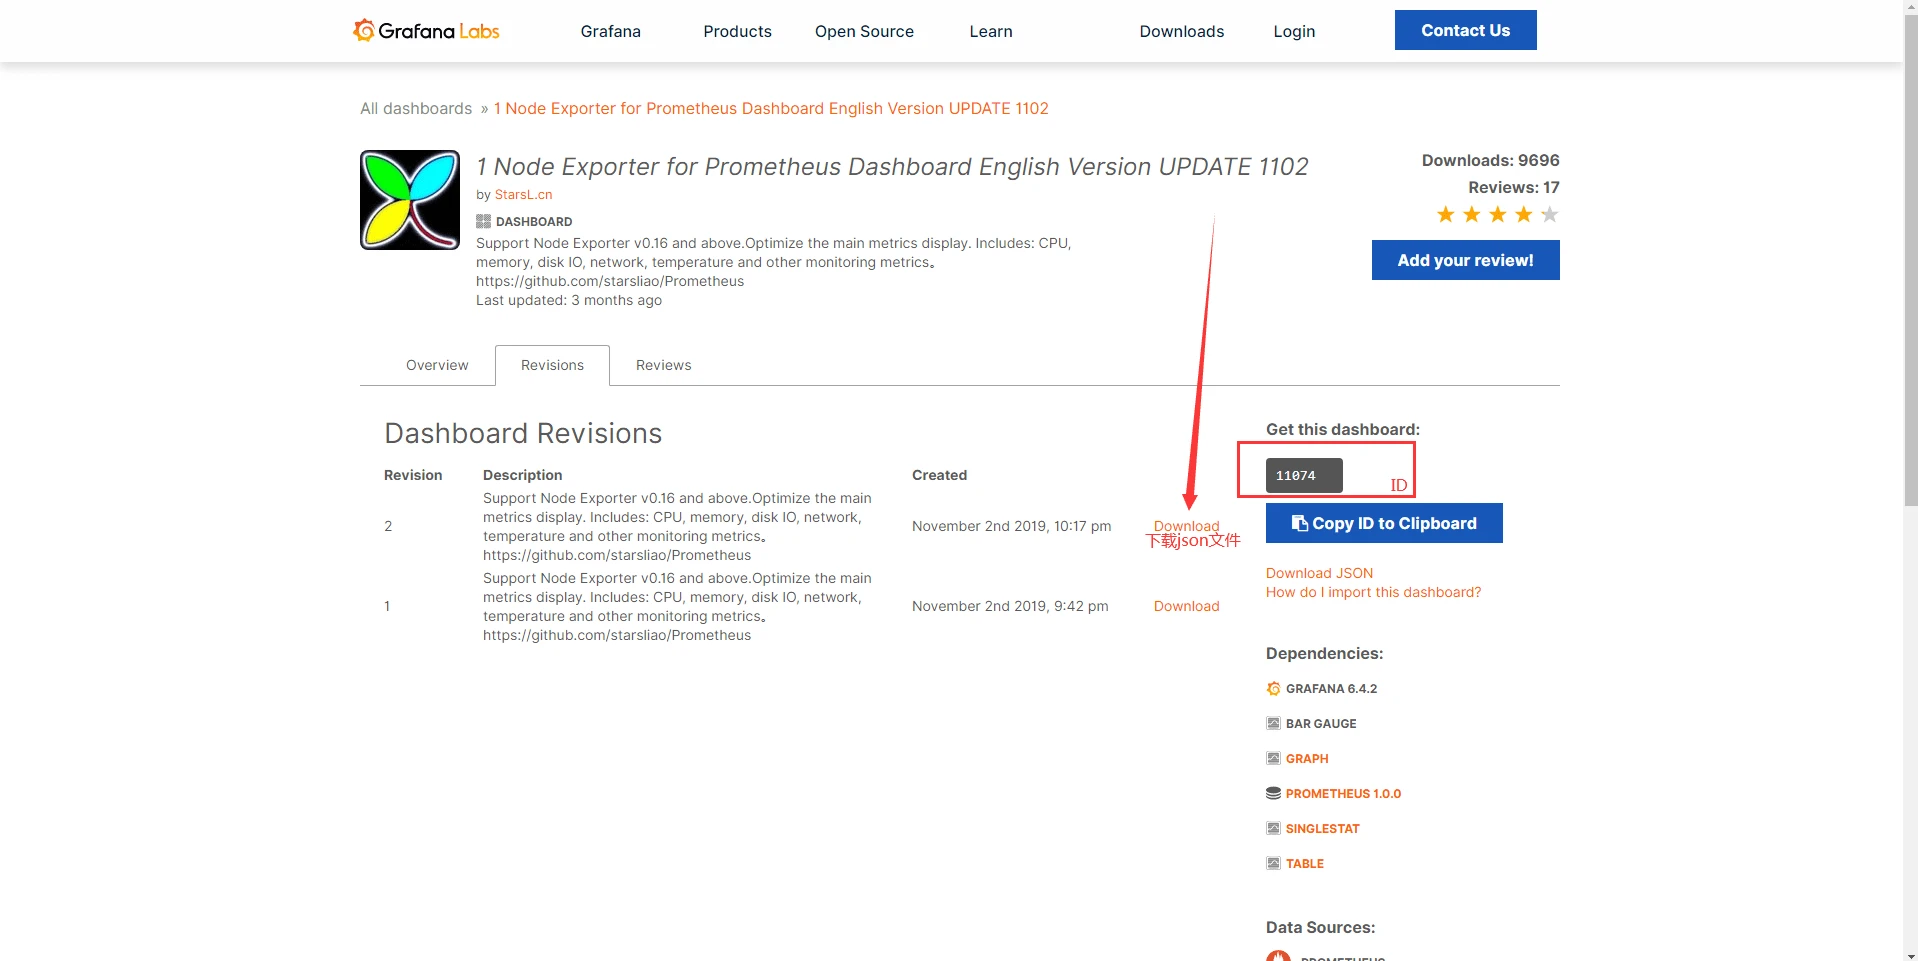
输入官方下载的Dashboards json文件或者Dashboards的ID获取
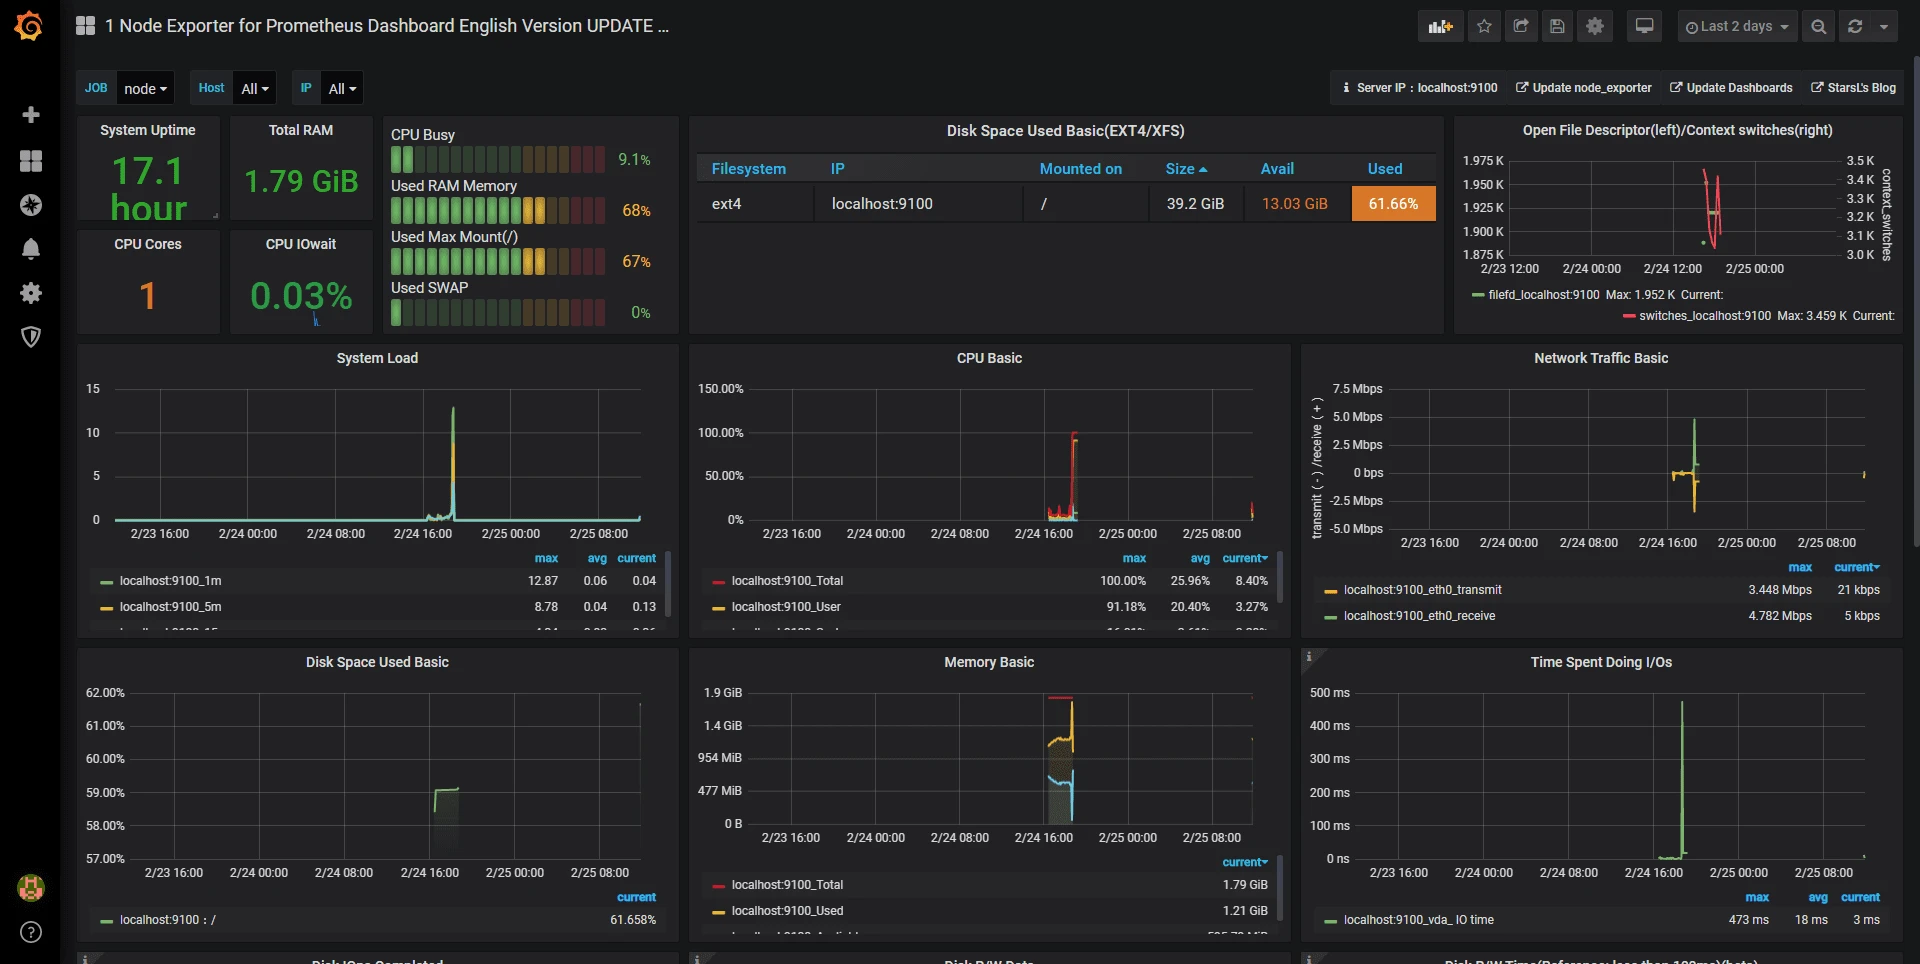
查看一下效果
完工
评论
参与讨论
请保持友善,共同维护良好的讨论环境。
讨论列表
0 条评论